This video provides a brief introduction to the Andrew's Pitchfork. To learn more about the history read below.
Pitchforks
The Andrews Pitchfork, how it came to be and where it is headed next...
1. Overview
Several of the analysis services available through Coghlan Capital have as a significant input, the humble Andrews Pitchfork and more importantly its forefathers, the Normal Line and Median Line. Like most things in life, a tool is as good as the workman wielding it. We have spent years honing the way in which we use these structures and have formulated a unique application (Clivity Analysis) that allows us to identify trend direction, strength and changes in behavior.
This page has been put together as a single comprehensive page that answers some basic questions that will allow the reader to understand:
• Where did the Andrews Pitchfork come from?
• What types of Pitchfork are there?
• How does Coghlan Capital continue to improve upon and use these methods?
There is a need to look back in time somewhat.
Many people have heard of Dr Alan Hall Andrews, the inventor of the Andrews Pitchfork. Very few have heard the names Roger Babson or George Marechal. Fewer still have heard of the Normal Line or BabsonCharts. The fact is that without Babson and his Normal Line, the Andrews Pitchfork as we know it would not exist.
2. Where did the Andrews Pitchfork come from?
The Andrews Pitchfork has at its origins the drowning of a young girl in the Annisquam River in Gloucester, Mass in the 1880s.
That young girl was the oldest sister of entrepreneur Roger Babson. Babson, a young boy at the time later described the incident "...they say she drowned, but the fact is...she was unable to fight gravity which came up and seized her like a dragon and brought her to the bottom."
Babson became obsessed with gravity, calling it 'our enemy No.1'. Through his early studies and research into gravity and its effects he came to value the work of the British physicist and mathematician, Sir Isaac Newton. Babson had a special interest in Newton's third law of motion - "For every action there is an equal and opposite reaction". Babson applied this in his fight to harness gravity, even going so far as to found the Gravity Research Foundation in 1960 which to this day issues rewards for essays by scientist on gravity related topics.
His interest in Newton's Third Law resulted in his applying it to many aspects of both his personal and business life, seeing a natural order and balance in all things.
In the fall of 1901 Babson contracted tuberculosis and as a direct result of this left the city and moved to Wellesley Hills, Mass to ponder his future. In 1904 Babson and his wife Grace launched the Babson Statistics Organization (later to be known as Babson's Reports) , which would see him to sell his analysis of stocks and bonds in newsletters to banks. That analysis is how Babson applied Newton's Third Law to the stock markets and how we come to be introduced to the Normal Line.
The Normal Line was the way in which Babson charted and predicted times of prosperity and recession. He opined that price trading above the Normal Line indicated prosperity, whereas a move beneath the Normal line indicated recession or hard times.
This example of a Babson Chart from 1919 clears shows the Normal Line, the line about which price fluctuates.
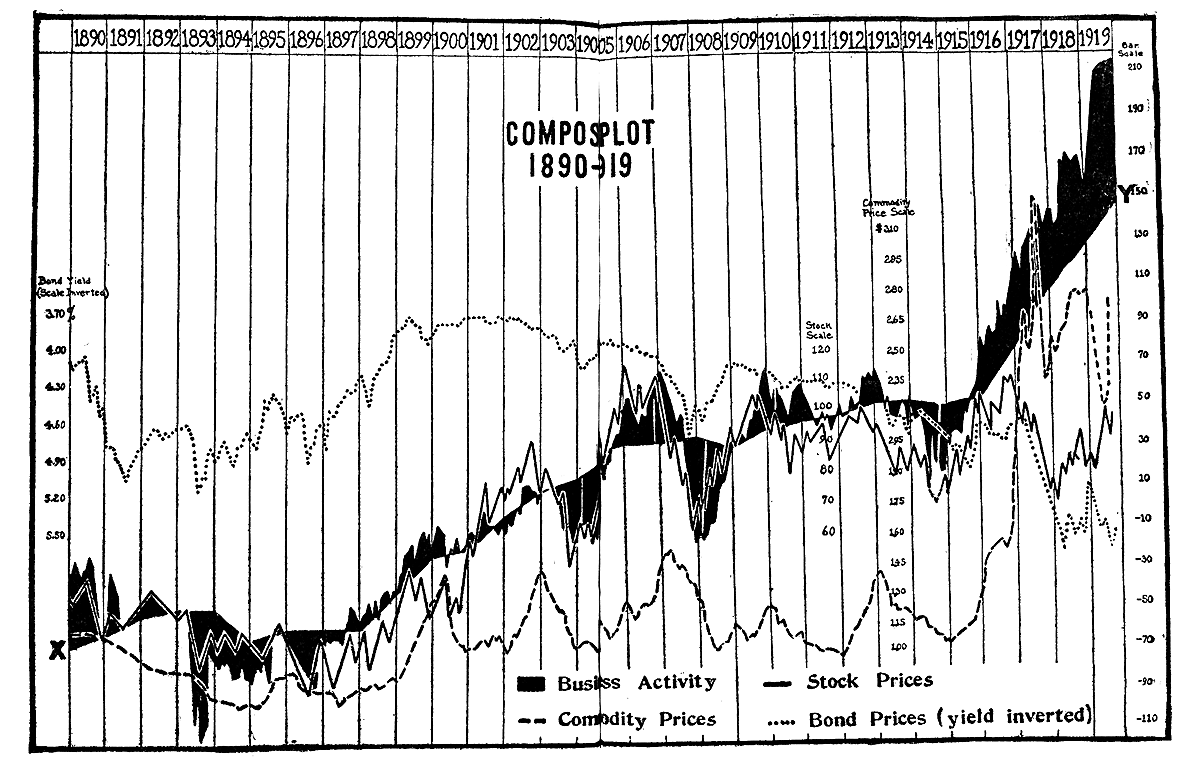
Babson predicted turns in the market AND the length of those turns using the Normal Line, believing that the volume of the shaded areas above the line would over time equal those beneath. Again, a natural balance or order to the markets with each action (move above the line) being met with an equal and opposite reaction (the move below the line).
The Normal Line is the predecessor for what we will soon look at and know now as the Median Line.
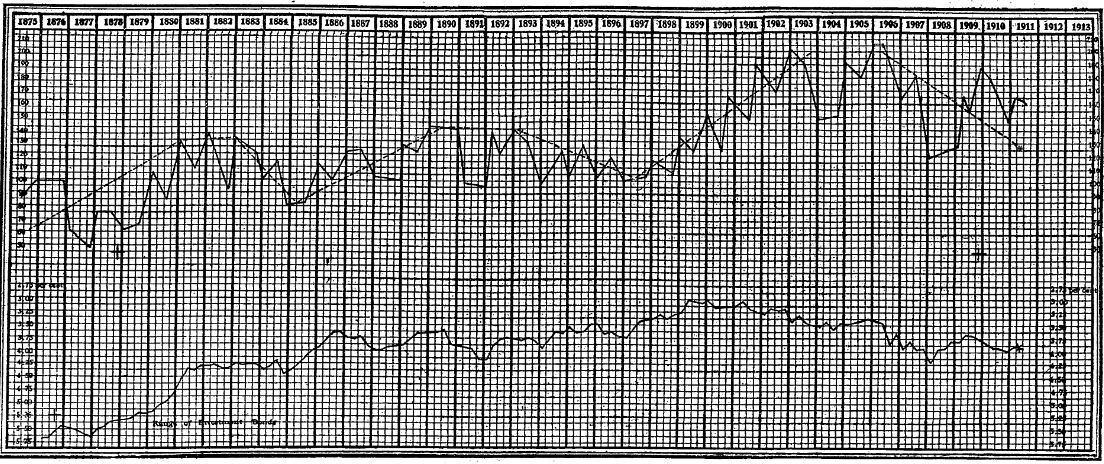
Taking the evolution one small step nearer to the Pitchfork, see the chart below. This chart prepared by Babson in 1912 shows turns in Bonds from 1875 to 1911.
See how he added in the Normal Line and see how price fluctuates about it.
To help the viewer I have highlighted in red the Normal Line to accentuate it in the modified version of the same chart below:
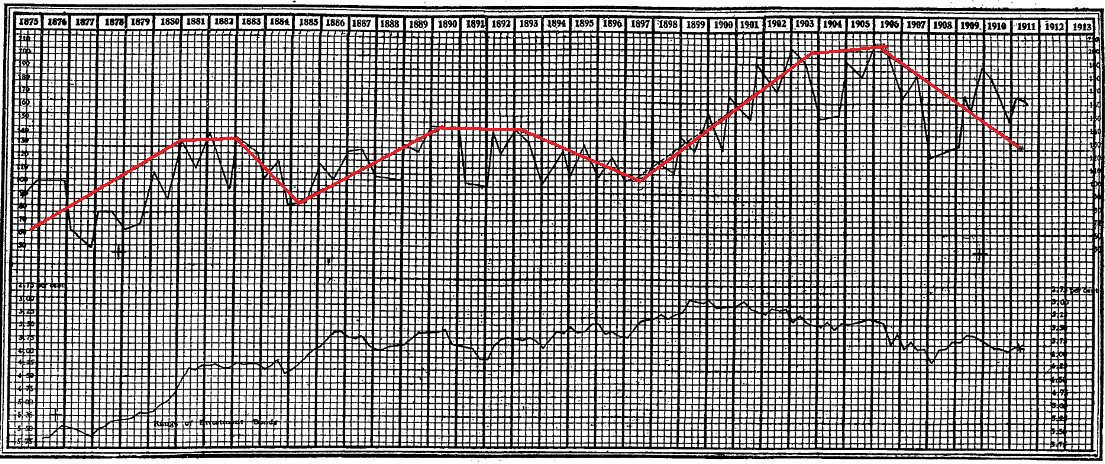
Try to understand that what Babson was doing here was identifying the slope of price and where it might turn. Imagine if you will that each line represents the central spine of an Andrews Pitchfork.
Babson continued to apply this method of analysis throughout the 1920 and in the fall of 1929 became a household name with a timely prediction based upon the use of his Normal Line. On September 5th 1929 Babson gave a speech where he stated that "...a crash is coming, and it may be terrific". That same day the markets declined by 3% and this became known as the "Babson Break". The Wall Street Crash, or Black Tuesday occurred just one month later. Babson had used his Normal Line to avoid catastrophic losses.
The Median Line and George Marechal
From this point we need to consider George Marechal, a chartist for which there is very little known other than he was a friend to both Roger Babson and Alan Andrews and that he authored one of the most amazing charts known.
In 1933 incoming US President Franklin D Roosevelt reached out to Babson for a forecast for the US stock markets for the near future. Babson in turn consulted George Marechal who prepared a 15 year forecast from 1933 to 1948. So confident was he in the accuracy of his prediction that he had the chart copyrighted at the time.
The chart you see below is the Marechal prediction, the upper line representing his forecast and the lower the actual performance of the Dow Industrials over the period 1933-1948.
Pause for a moment to consider that this prediction encompassed 15 years and a World War not even yet on the horizon...
Marechal's exact method died with him but what is clear is that he was using a version of Babson's Normal Line. The annotations added by his friend Alan Andrews show that he plotted turns with what are now known as Median Lines. With Median Lines we step closer in the evolution towards the Andrews Pitchfork.
As with the Normal Line, the Median Line is drawn to show a line of balance, a line about which price fluctuates.
To draw a Median Line we need three alternating pivot points, A, B and C as shown in the chart below.
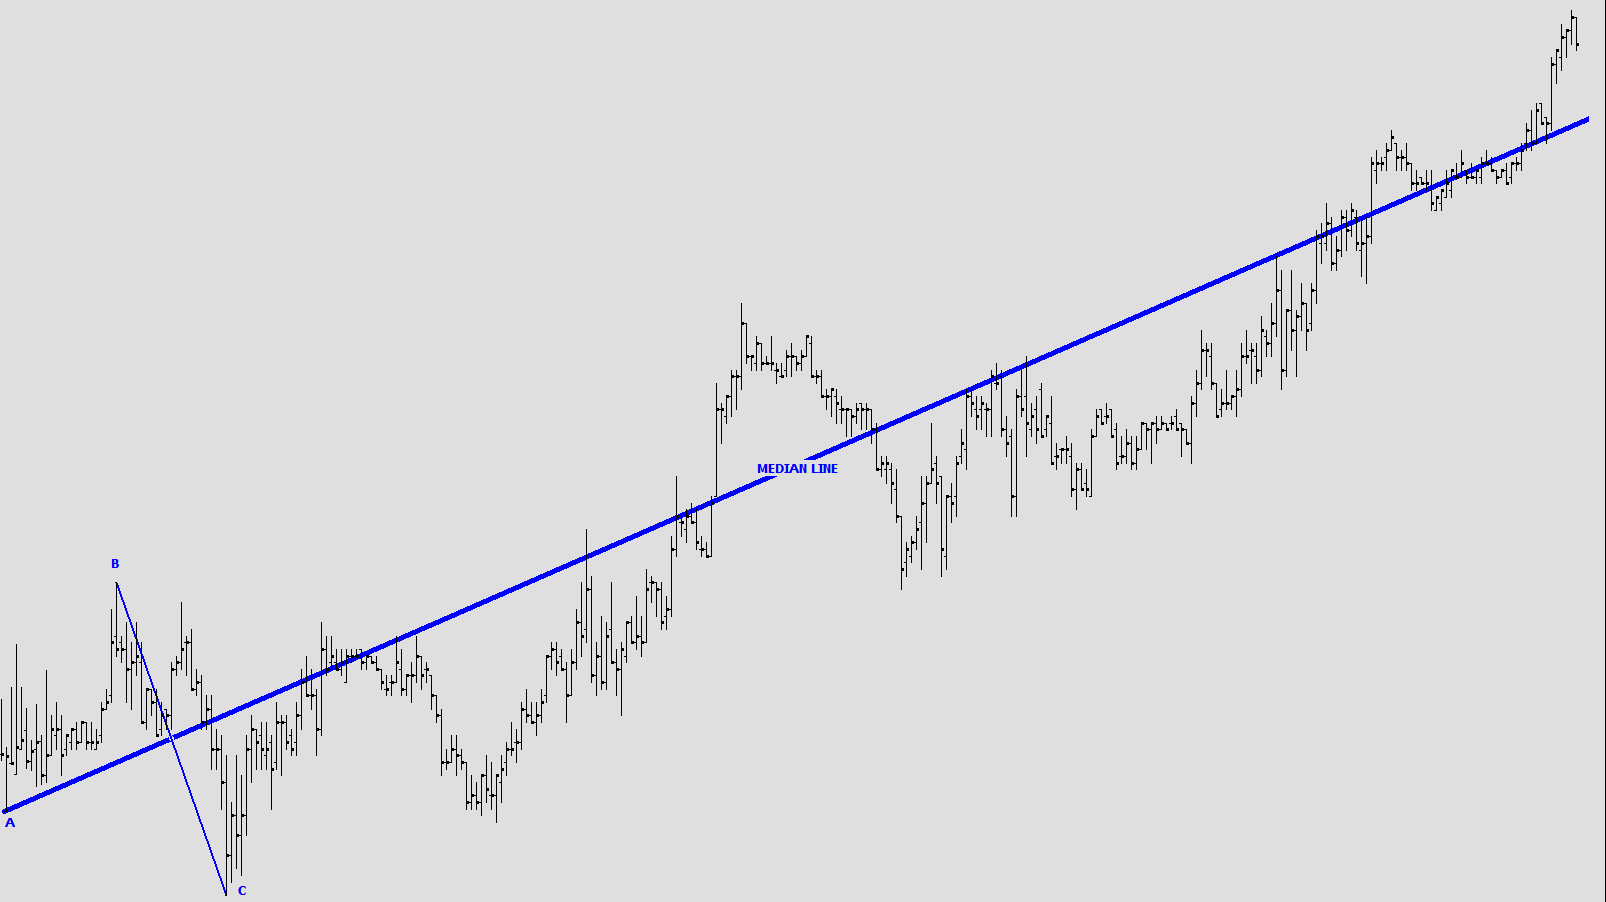
The Median Line is the line drawn from the A pivot, to bisect (through the median) of the B-C line.
Look again at Marechal's chart above and visualize Median Lines drawn from each pivot (marked P) through the median of the next two pivots.
At this point you are seeing something far more familiar as the beginnings of the pitchfork.
To recap. From Babson we have the concept of action/reaction, balance, equilibrium and the Normal Line. Marechal remains somewhat clouded in mystery but gives us the Median Line, a clear derivation of Babson's Normal Line.
Enter Dr Alan Hall Andrews and his Pitchfork
Alan Andrews took Marechal's Median Lines and added what we know today as the upper and lower parallels. The upper and lower parallels are lines extended from the B and C pivots, forming upper and low rails to the structure. See the chart below which has had the previous Median Line extended into a fully fledged Andrews Pitchfork.

It is apparent that the upper and lower parallels in this instance accurately show support and resistance for the vehicle whilst the Median Line shows the slope and the point of balance. Some analysts mistakenly refer to these added lines as the Upper and Lower Median Lines. This is incorrect, there is only ONE median line, the central spine.
Drawing the Andrews Pitchfork
The first step in drawing a pitchfork is to identify a significant high or low from which to draw the fork. This will typically be a high in the case of a down trending market and a low in the case of an up trending market.
In short, the initial selection of the A pivot will determine the direction of fork.
The remaining pivots will alternate, thus if the A pivot was a high than the B pivot will be a low and the C pivot will be a high. The following chart which shows a down trending Andrews Pitchfork and clearly illustrates this.
The primary purpose of the Andrews pitchfork is to identify the slope of price and importantly, any change in that slope, i.e. a change in the trend direction.
Jerome Schiff, perfecting the Pitchfork
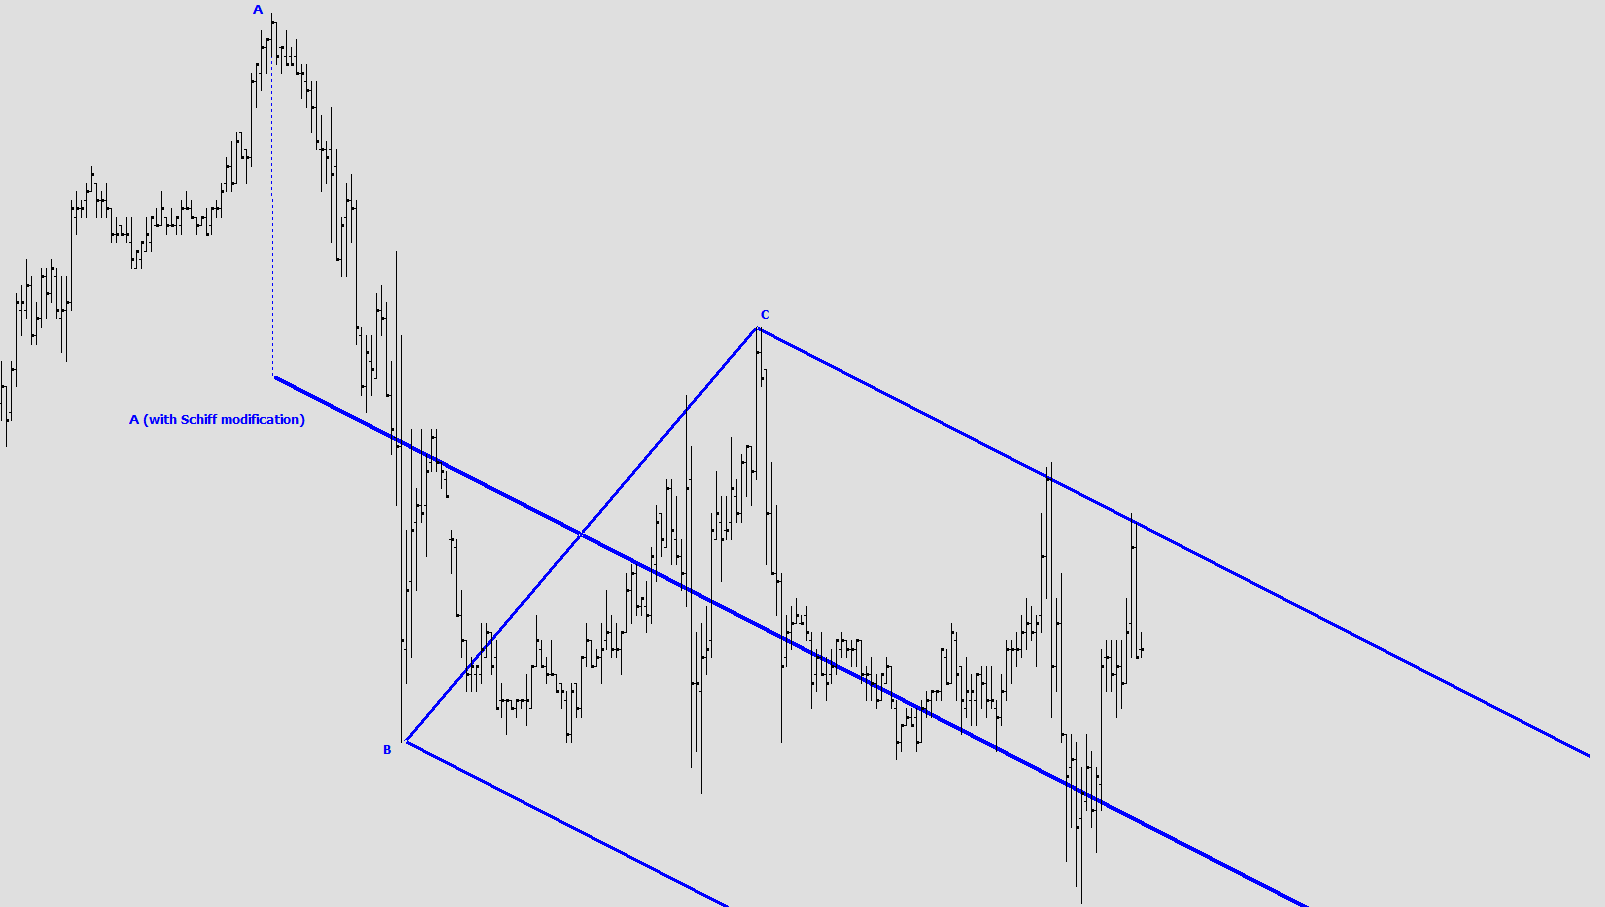
There is a final twist to the story. Alan Andrews worked with many traders, teaching his various chart structures. One, a New York trader named Jerome Schiff, came to Andrews with a hypothesis that in many case where a vehicle is in a shallow up or down trend, the pitchfork is to steep and he devised a manner by which the fork could be made to predict a more shallow path. That variation of the pitchfork is known as the Schiff Pitchfork.
In this variation the A pivot is moved up 50% of the way in price towards the B pivot. The chart below shows this:
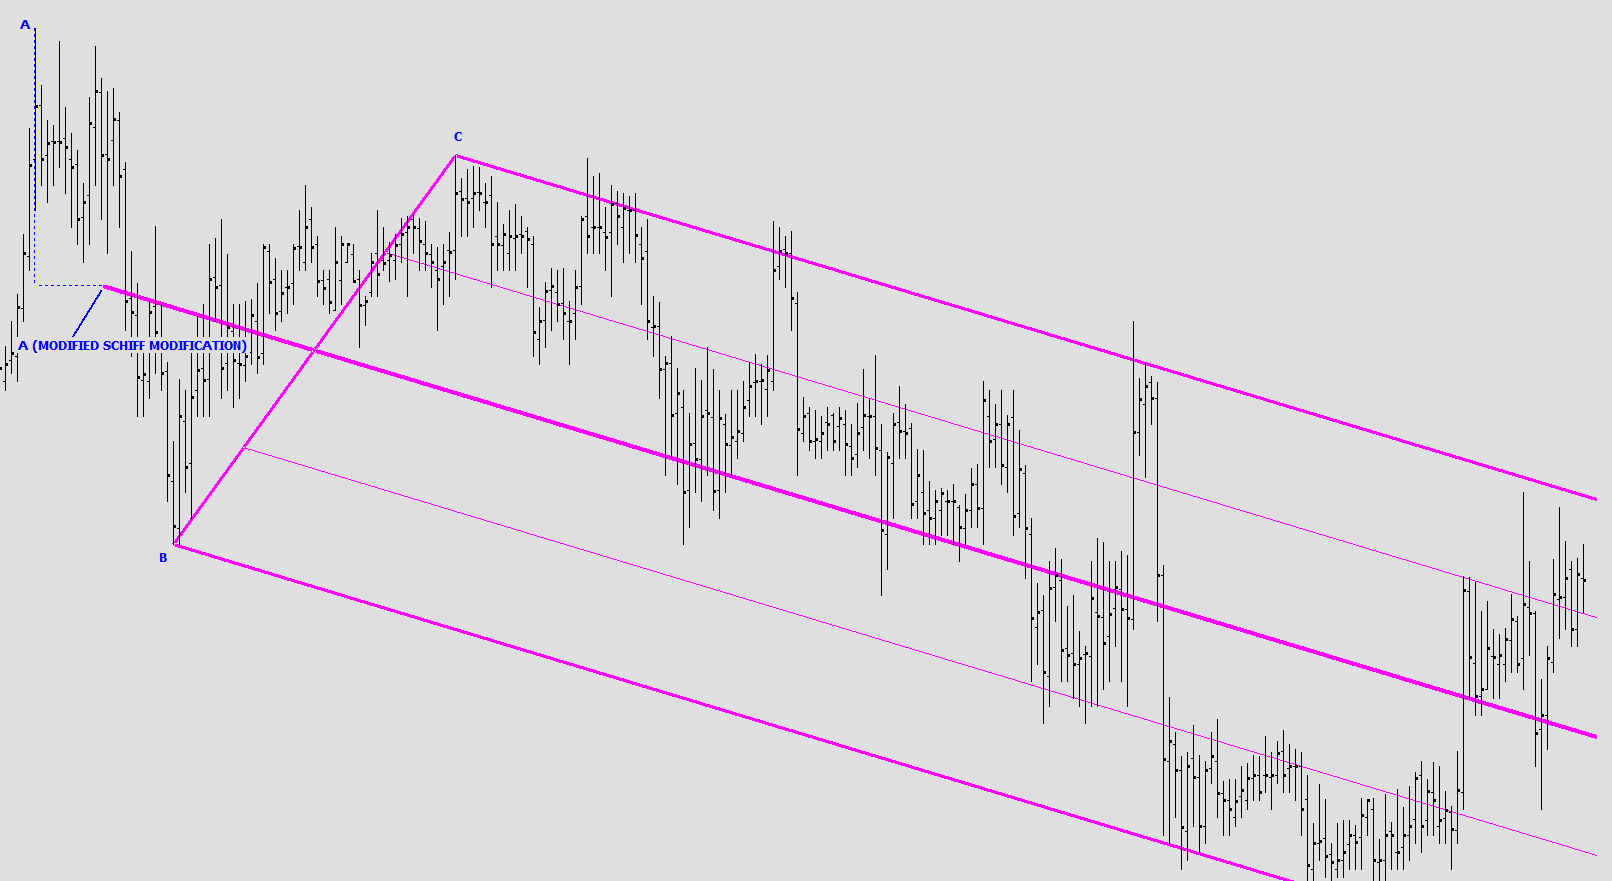
Andrews in turn responded that if one were to move the A pivot along the price axis then it would be logical to equally move it along the time axes, thus giving us the Modified Schiff, the third and final commonly used version of the pitchfork.
The chart below shows a Modified Schiff fork with the A pivot moved BOTH 50% in price and 50% in time towards the B pivot.
These three variations on the humble pitchfork make up with is known as pitchfork analysis but as you can see, each incorporates a Median Line at its core and that in turn owes its birth to the Normal Line and from there...the fact that each and every action has an equal and opposite reaction. In short, market balance, equilibrium.
Although the Andrews pitchfork is a tool bundled within many charting platforms, it is typically used briefly and in a cursory manner by those that value technical analysis. As you have seen, the Andrews Pitchfork has a pedigree that dates back to the earliest part of the 20th century when Babson used it to personally amass a $50 million fortune using his Normal Line. I would urge the reader to devote some time to this method of analysis, it is without a doubt the most powerful technical indicator I have seen.
3. Where do we go from here and how does Coghlan Capital use these methods?
I have used the word evolution in this document several times for a specific reason. It would be wrong to think that the process of improvement ended in the 1960s with Dr Andrews. The concept of predicting market balance and turns through the application of a Normal/Median Line has continued to evolve through Coghlan Capital founder, Paul Coghlan. He has generated over thirty thousand charts as he strives to understand how Marechal managed to produce the most amazing chart ever. That work continues and advances to the methods pioneered by Babson and Marechal have resulted in Clivity Analysis, a methodology that makes up the core of the Morning Analysis and Cross Pair Analysis services and produces trades for the Coghlan Forex and ESTrades service.
Clivity Analysis
The advances focus almost exclusively on the work undertaken by Babson and Marechal. Andrews made a noteworthy contribution, the Andrews Pitchfork. But it can be clearly seen that the bulk of the work was performed in an earlier era.
The market clearly has a balance to it, once a working slope has been identified it provides traders with direction, trend strength and critically, changes in behavior which allow that trader to prepare for a turn or counter trend move. Time and time again through what I refer to as Clivity Analysis, the analysis of financial instruments through the use of slopes has provided me with an insight into turns that appear to elude the majority of analysts.
99% of analysts look at the horizontal when viewing a chart, this is incredibly myopic. They will refer to horizontal lines of support and resistance whilst acknowledging that a market is rising or falling. Clivity Analysis all but ignores the horizontal aspect of the chart and focuses instead on identifying the current slope (trend), looking for a rise or fall WITH RESPECT to that slope (trend strength) and watching for a change in behavior (trend breakdown). Not a week goes by without my receiving emails from clients that express amazement at the accuracy with which this method of analysis works.
I am strongly of the opinion that analysts I have seen that utilize similar methods, from pitchfork analysis to median line analysis, do so in a way that doesn't come close to leveraging the vision of Babson and Marechal. With Clivity Analysis I aim to dig deeper and come close to the methods used by Marechal.
Rather than simply 'draw a pitchfork', I aim to fulfill three objectives with every chart/vehicle through a variety of tools and methods.
• Identify the current slope
• Identify the current floor and ceiling within that slope
• Be alert to a change in behavior/context
These priorities are evident in each of the vehicles we chart and trade in our services.
I continue to develop Clivity Analysis and welcome those that wish to become familiar with its abilities.
Paul Coghlan
Coghlan Capital
4. More Resources
If you are interested in reading some of Babson's early writings you can find several of his New York Times articles listed below.